- /
- Research Paper / Analysing Mechanical Behaviour of HDPE bottles through deflection-based mapping & load vs deflection curve characterisatio
Analysing Mechanical Behaviour of HDPE bottles through deflection-based mapping & load vs deflection curve characterisatio
15-4-2026
Abstract
The research paper ‘Analysing Mechanical Behaviour of HDPE bottles through deflection-based mapping & load vs deflection curve characterisation’ is a way to establish a methodology to showcase how the equipment ‘Top load Tester’ can help determine the mechanical phenomena of compression. The intended purpose of this research is to make a criteria where High-Density Polyethene bottle manufacturers can rely on early and fast analysis of mechanical behaviour like buckling, collapse, creep, deformation, or instability. The issue happens while making a bottle where improper wall thickness due to poor material distribution, poor rib design, and disproportionate use of recycled HDPE reduces the overall strength of HDPE bottles.
The Research paper is intended to solve the problem of the HDPE bottle manufacturer, where, rather than fully collapsing the bottle, the user can judge the overall strength of the bottle by compressing it to a certain percentage of deflection to map the strength of the bottle. This methodology will not only help the user to judge the quality of the bottle, but it will also help in speeding up the QC process and preventing the samples from being wasted. Deflection-based compression test on HDPE bottles helps in deforming the bottle to a certain % which will help in checking the wall thickness, neck finish, shoulder rigidity, label panel strength, and croaker bottom much faster than fully collapsing it.
The load v/s displacement curve will give a better understanding of the design-related faults in the bottle. The research paper will take a different HDPE bottle, and then it will be compressed to a certain %. Each curve depicts a certain kind of characterisation related to bottle strength or overall design.
Illustration
This is just for illustrative purposes. The actual curve will be seen in the Observation section of the paper.
| S no. | Deflection (mm) / % collapsed deflection | Curve behaviour | Mechanical Interpretation |
| 1 | 2 mm | Linear-Elastic | No fault |
| 2 | 4 mm | Slight non-linearity | Deformation begins |
| 3 | 6 mm | Reduced slope | Buckling (ductile quality) |
| 4 | 8 mm | wavy / non-linear | Poor material distribution |
| 5 | 10 mm | Sudden drop | collapsed |
The ideology behind making this tabulation is to raise awareness of the QC and R&D regarding the importance of & based deflection analysis to compare the bottle quality rather than fully collapsing it. As it usually happens that the quality is best judged at a certain point of deflection.
For eg, at 4 mm deflection, an HDPE bottle can be compressed in a Top load tester, and the yield behaviour can be easily observed. Secondly, at 10 mm deflection, the creep behaviour of the sample can be judged (not every bottle shows creep behaviour at 10 mm).
Literature Review
Various studies have been done related to HDPE bottles quality in terms of compression strength analysis, viscoelastic behaviour and Environmental stress testing. The analysis for the compression test has usually been done through peak load identification.
Elleuch, R., & Taktak, W. (2006). Viscoelastic behaviour of high-density polyethylene polymer under tensile and compressive loading. Journal of Materials Engineering and Performance. The mechanical behaviour of high-density polyethylene (HDPE) under tensile and compressive loading has been widely investigated, highlighting its viscoelastic nature and deformation mechanisms under mechanical stress (Elleuch & Taktak, 2006).
Schmidt, F., et al. (2019). An integrative simulation concept for extrusion blow-moulded plastic bottles. Finite Elements in Analysis and Design, 164, 69–78.
Analysis shows the behaviour of HDPE in terms of how buckling occurs: buckling usually starts with elastic deformation and then enters plastic deformation, where it is known as the yield point.
Studies have also examined the packaging qualities, including stacking performance. The wall thickness, bottle geometry, and uniformity in the distribution of the bottle making. Hence, many journals have also given ideas and insights on how bottle geometry impacts the stacking behaviour and quality of bottles. The primary indicator of bottle strength has conventionally been the maximum load achieved by the bottle during the compression tests.
Failure mechanisms in blow-moulded HDPE containers are often associated with material properties such as crystallinity and structural stress concentrations that may lead to brittle fracture or crack formation under mechanical loading (Sanchez et al., 2001)
The conventional and intermediate stage of testing hardly takes into account the quantification in the standard operating procedure, where indexation can be really helpful. Secondly, the peak load testing does not take into account the early failure, structural stiffness, and rigidity, which can be more comprehensively inferred at the specific points.
Correlating the failure risk, stability, and strength of bottles at a specific level of compression is a way towards a more sustainable, fast, and more insightful way of understanding the quality of bottles, as well as giving insights on how the bottle design has actually been made and how well the distribution of material is being done for the bottle.
Material & Experimental Setup
3.1. HDPE Bottle Specifications
| S no. | Capacity | Wall thickness | Geometry | Image | Diameter (cap) |
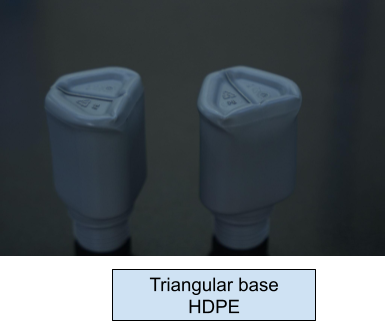
| 1 | 100 ml | 2 mm | Triangular | 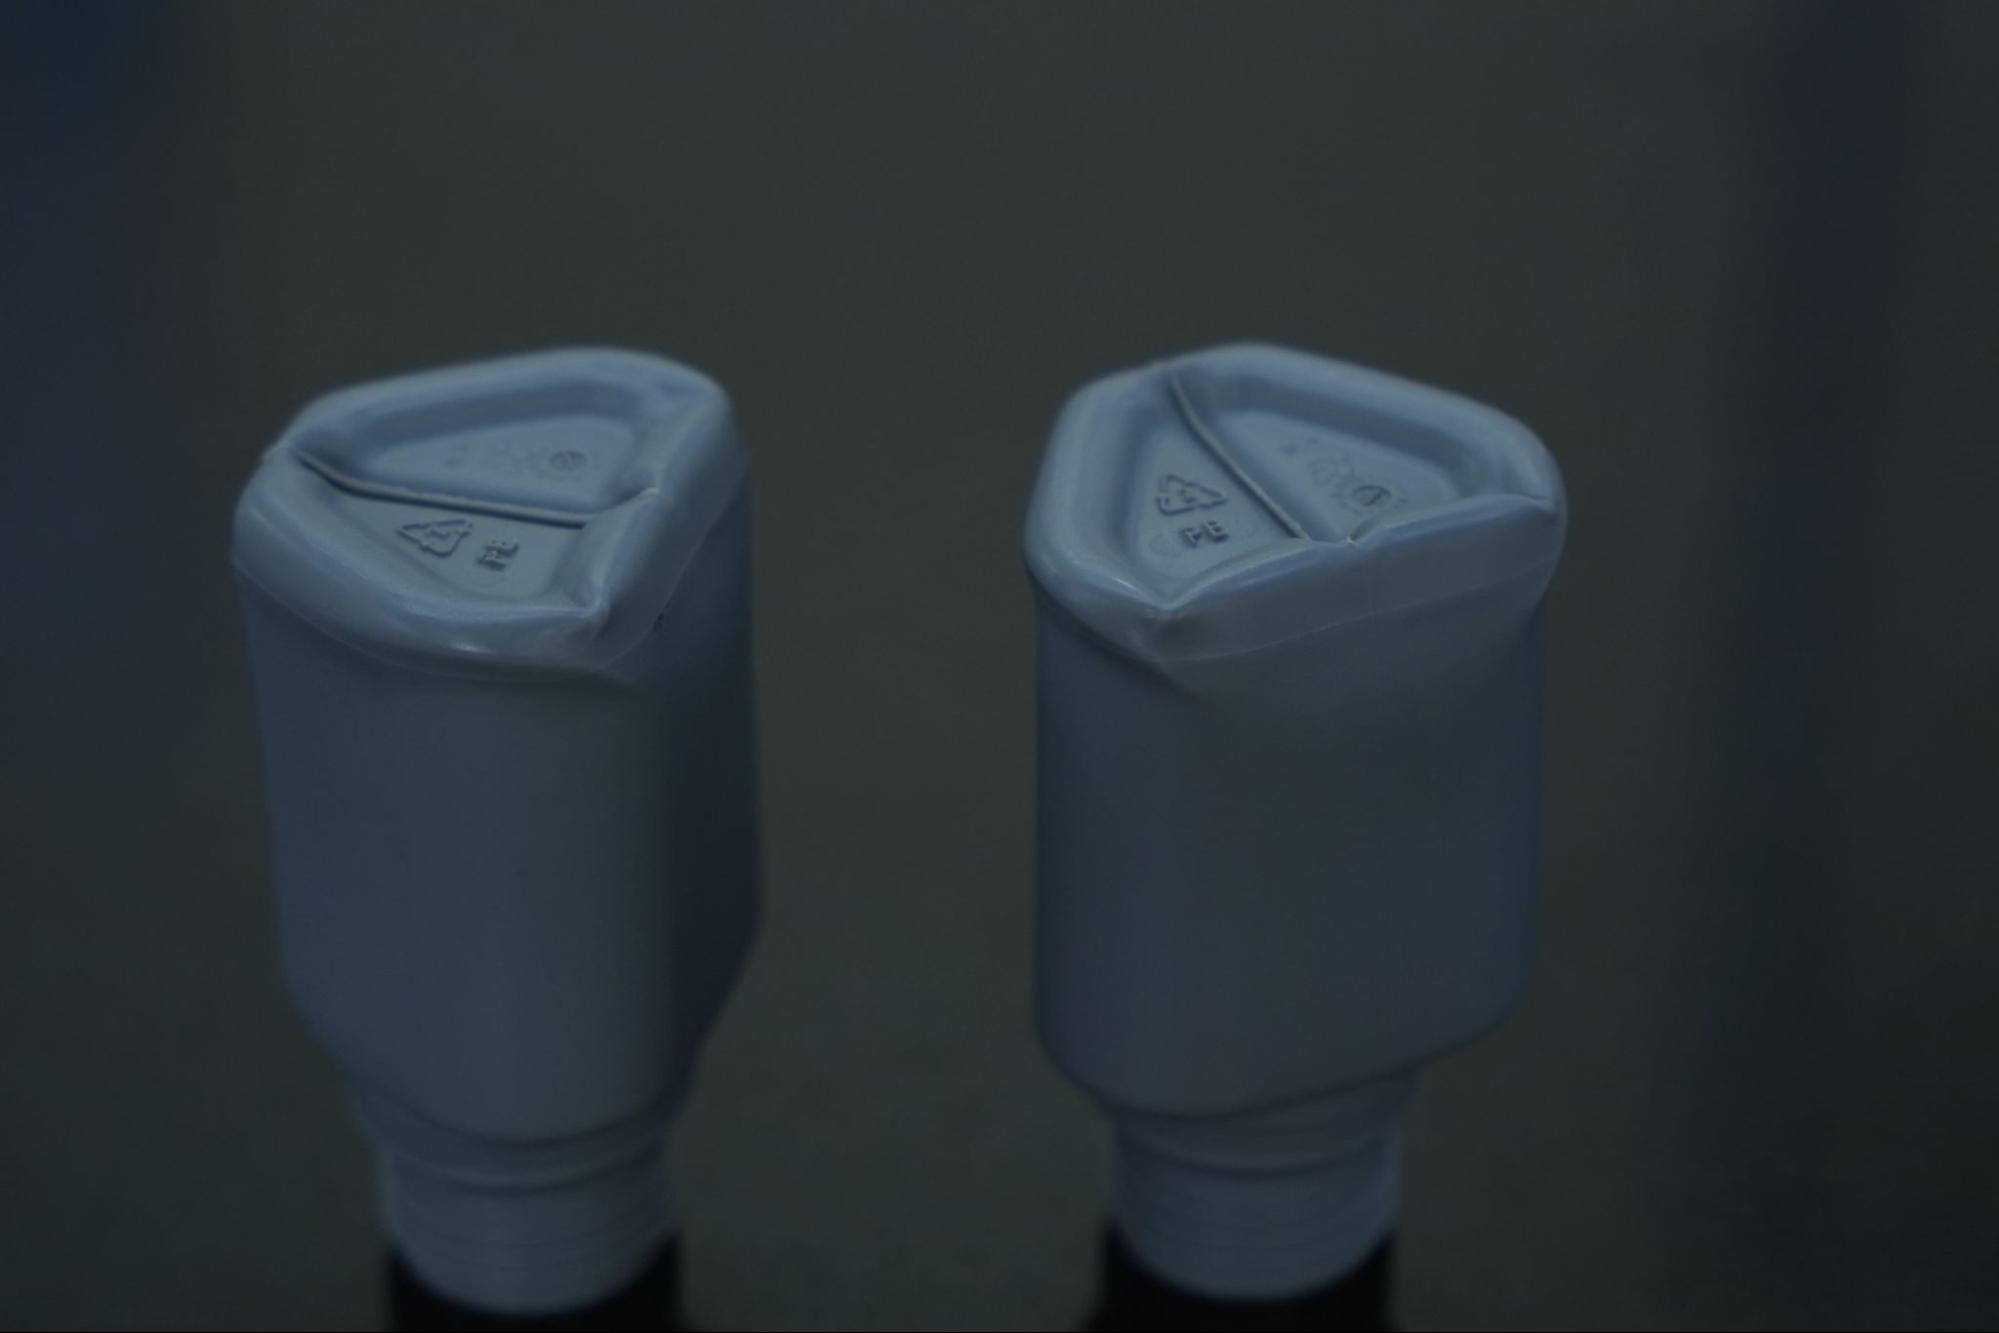 |
30 mm |
| 2 | 300 ml | 1.32 mm | Round / Cylindrical geometry |  |
50 mm |
| 3 | 1 liter | 1.30 mm | Round / Cylindrical geometry | 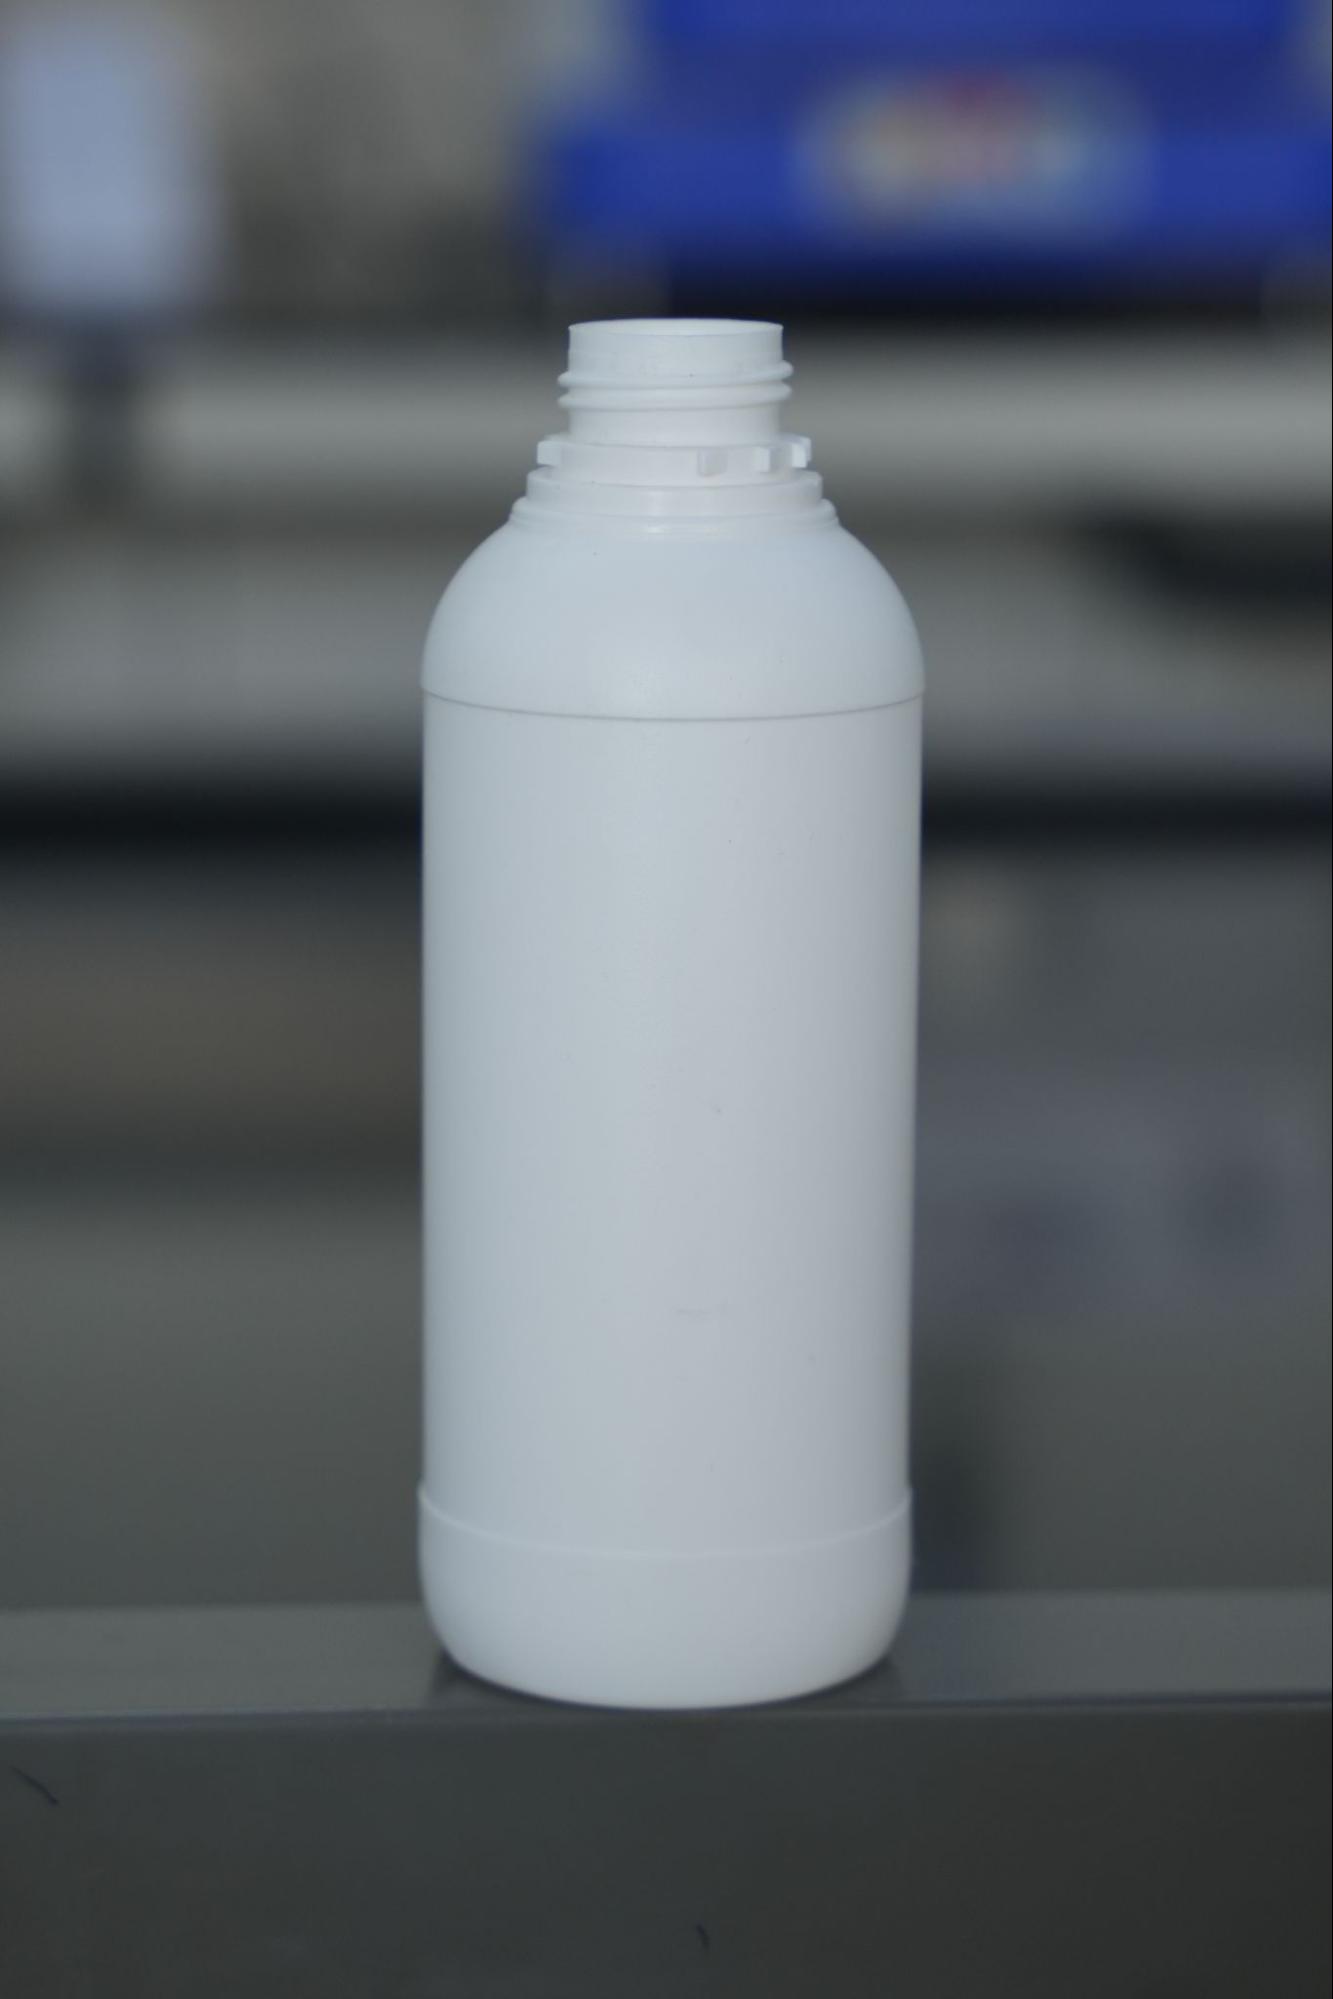 |
30 mm |
| 4 | 1.5 liter | 1.55 mm | Round / Cylindrical geometry | 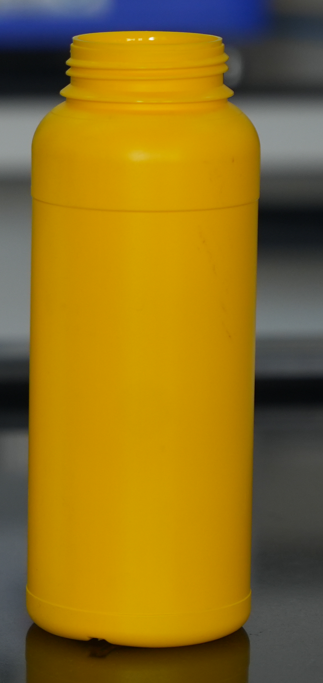 |
60 mm |
3.2. Testing Equipment
| 1 | Equipment | Universal Testing Machine |
| 2 | Load cell | 500 kgf |
| 3 | Test speed | 50 mm/min |
| 4 | Software | Zeus Ultimo |
| 5 | Diameter of the compression plate | 180 mm |
Research Methodology
4.1. Deflection-based Mapping
Deflection-based mapping test is being perform on two same kinds of sample. The main purpose of this kind of testing is to analyse the different deflections, like 3mm, 4 mm, 6mm, 8 mm, etc. The tabulation will help to compare the sample where we do not need to perform the full collapsing of the bottles, and just by a percentage deflection, the sample behaviour can be analysed.
| S no. | Deflection | Load for HDFE 1 | Load for HDFE 2 |
| 1 | 3 mm | 91.3kgf | 79.5kgf |
| 2 | 4 mm | 119 kgf | 93 kgf |
| 3 | 6 mm | 133 kgf | 128.5 kgf |
| 4 | 8 mm | 135.7 kgf | 131.5 kgf |
| 5 | 12 mm | 151.6 kgf | 120.4 kgf |
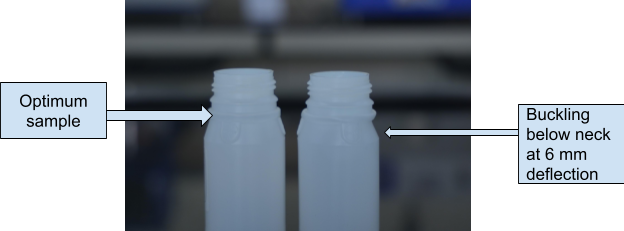
Now it is clear here that how the two bottles very differently at same deflection so it is not required to collapse the bottle and the quality testing procedure fully can be done faster by the deflection based mapping of samples full stop whatever the issue sample faces for example in the hdpe 1 sample at 12 mm deflection sample collapsed at 151.6 kilogram force And the second sample collapsed at 120.4 Kgf but this kind of analysis was already happened at 3 mm or 4 mm deflection where the sample is HDPE 1 is taking more load hence shows more buckling strength. For example, if the sample is buckling from the shoulders or the issue is in the bottom, everything will be very clear.
For illustration, we have images of the bottles where the sample has collapsed from the bottom. Secondly, there is also a sample that collapsed from the neck portion, and this was discovered at 6 mm deflection; the reason was the lower wall thickness at this end. In the triangular HDPE samples, the wall thickness is 2 mm at the shoulders and label panel, while the thickness is low at the bottom, which is clear with this compression testing with a deflection-based mapping system.
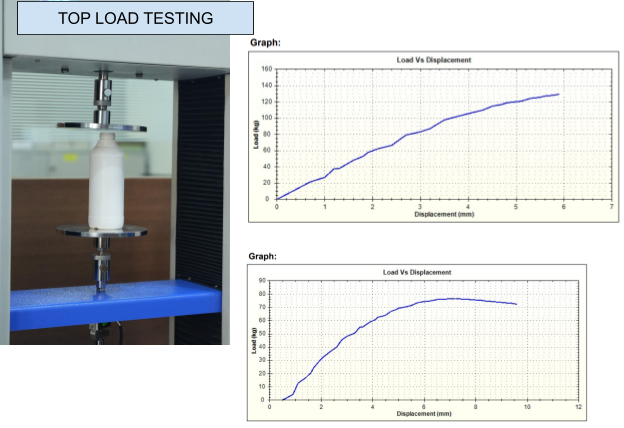
4.2. Load v/s Displacement Curve – Mechanical Behaviour Analysis
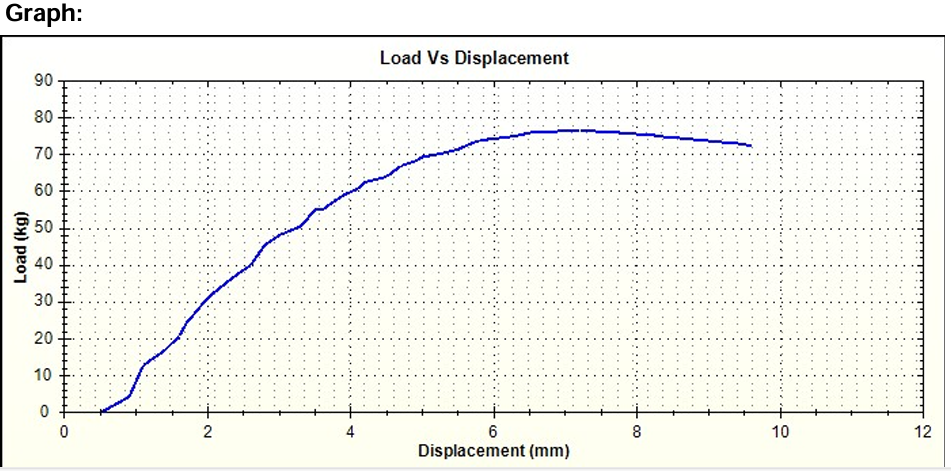
Graph:
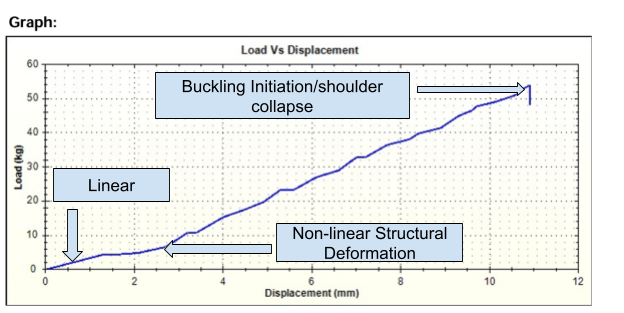
With this load versus displacement graph, it is clear that each mm of deflection indicates the mechanical behaviour of a high-density polyethylene bottle. For example from 0 mm to 1 mm there was a sitting elastic region here the sample was in contact with the compression plate and then it started increasing the slope after that at 2 to 4 mm you can see the non linear structural deformation after that from 6 mm to 8 mm can be seen that the slope is linear it is increasing but at some point the graph is non linear also which shows the material distribution of sample wherever this graph is showing a curve it shows that those points there is the non uniformity in the material distribution bottles like after that the sudden collapse indicates that the sample.
4.3. Quantified Contribution by the Deflection-Based Mapping in Comparison to the Conventional Peak Load Method
1. Reduction in Time of Testing
When we are performing the deflection base test, the user deflects the sample to a certain millimetre, for example, at 4 mm deflection or 6 mm deflection. However, in the conventional method, the sample is compressed to its maximum limit, where it takes 13 to 16 mm, depending on the geometry of the sample and even beyond.
Considering the recent research:
| S no. | Deflection | Load for HDFE 1 | Load for HDFE 2 |
| 1 | 3 mm | 91.3 kgf | 79.5kgf |
| 2 | 4 mm | 119 kgf | 128.5kgf |
| 3 | 6 mm | 133 kgf | 128.5 kgf |
| 4 | 8 mm | 135.7 kgf | 131.5 kgf |
| 5 | 12 mm | 151.6 kgf | 120.4 kgf |
Here, User A performs Deflection-based mapping and performs quality Analysis at 6 mm of deflection. The result obtained is 133 kgf for HDPE 1 and 128.5 kgf for HDPE 2. It is clear at 6 mm, only HDPE 1 has good quality. Now User B performs the testing at peak load and receives the same inference, but takes more time. HDPE 1 takes 159 kgf with 14 mm deflection, and HDPE 2 takes 125 kgf with 13 mm deflection.
Calculation of Time saved:
Formula used: Time = Displacement / Speed
- In the deflection method:
6 mm deflection and 50 mm/min speed → 7 seconds - In the peak load method:
14 mm deflection → 17 seconds
13 mm deflection → 16 seconds
Hence, the time saved for Sample 1 is 59%, and for Sample 2 is 58%, which is significant when analysing in bulk.
2. Reduction in Sample Wastage
Some Samples regain weight at an analysis deflection of 3 mm. Rather than fully deflecting it at peak load, deflection-based mapping is a sustainable way to test.
Here, we tested 4 samples, and 2 regained shape at a deflection of 3 mm. Those samples can be used for similar or recreational purposes.
This directly shows 50% reduction in sample wastage when we perform the deflection-based mapping rather than the conventional methodology.
Observations
After all this discussion, it was observed that the load versus displacement curve analysis is a way to judge the mechanical behaviour of the sample, for example, in the interpretation of this graph. From 0 to 0.8 mm no structural deformation. The load increase was rapid, from 2 to 6 mm deflection from 5 to 80 kgs .After 6 mm the graph indicates that the issues of parallel flexing the wall deformation is being seen. And load versus displacement curve depicts one form of the mechanical behaviour or the other.
To summarise, In the first section on deflection-based mapping it was clear that the specific deflection-based compression can be performed to analyse the mechanical behaviour of the samples. There is no requirement of peak load detection analysis, which will increase the timings of quality testing and R&D.
Secondly, the usage of a curve to judge the quality or the behaviour of the samples depicts a lot which cannot be judged only through the peak load detection, and it helps in rectifying the issues of wall thickness, panel flexing, neck finish and shoulder collapse.
Further Scope of Study
- Temperature-based parameters can be included or result in deviation due to it.
- The number of samples can be tested more to analyse the result
- Further testing can be carried out for PET, LDPE, etc.
- Creep behaviour analysis can be done at specific deflection rates to simulate real stacking simulations
References
- ASTM D2659
- ASTM International. (2015). ASTM D2659 – Standard Test Method for Column Crush Properties of Blown Thermoplastic Containers. West Conshohocken, PA: ASTM International.
- Elleuch, R., & Taktak, W. (2006). Viscoelastic behavior of high-density polyethylene polymer under tensile and compressive loading. Journal of Materials Engineering and Performance, 15(3), 328–334.
- Schmidt, F., Hopmann, C., & Windeck, C. (2019). An integrative simulation concept for extrusion blow-molded plastic bottles. Finite Elements in Analysis and Design, 164, 69–78.
- Brown, R. (2012). Handbook of Plastic Testing and Failure Analysis. Elsevier.
Recent Research Paper
No records found